Our world is changing rapidly. The basics of project management that were common practice back in the day may no longer be the best way to do things. In order to stay ahead of the curve, you need to be able to adapt and change with the times.
One of the biggest changes in recent years has been the way that we visually process information. Thanks to advances in technology, we can now take in and understand complex data sets much more easily than ever before using a variety of different software
This trend has had a big impact on the world of project management. These days, more and more managers are using visual project management techniques to plan, execute, and track their projects.
If you’re not familiar with visual project management, don’t worry — in this article, we’ll give you everything you need to know. We’ll start by explaining what visual project management is and how it can benefit your projects.
Then, we’ll share some of the best tools and techniques that you can use to get started with visual project management.
Let’s get going!
What is Visual Project Management
To break it down in simple terms: visual project management is a process that uses visual aids to help project managers ensure their projects operate as smoothly as possible.
By using visuals, project managers can more see the big picture more easily and identify potential problems or risks.
There are a number of different ways to incorporate visuals into your project management process. Some common techniques include using mind maps, flowcharts, and Gantt charts.
Using visuals can help you in a number of different ways. For example, if you’re having trouble understanding a complex data set, visualizing it can make it much easier to understand.
Additionally, using visuals can help you communicate your ideas more effectively to your team. We will discuss further benefits of visual project management in greater detail later on in the article.

Visual Project Management Tools
Now that we’ve understood the essence of visual project management, it’s time to focus on the tools and techniques we can use to implement this strategy. To help you get started, we’ve compiled a list of our favorite tools and techniques below.
1. Gantt Charts
Gantt charts are one of the most popular and commonly used tools in visual project management. If you’re not familiar with them, Gantt charts are simply a type of bar chart that is used to illustrate a project schedule.
They can be used to track the progress of individual tasks, as well as the project as a whole.
Gantt charts are most useful in projects where there are a lot of interdependent tasks and can be used to track milestones and deadlines. By using this visual tool, you can easily see which tasks need to be completed before others can begin.
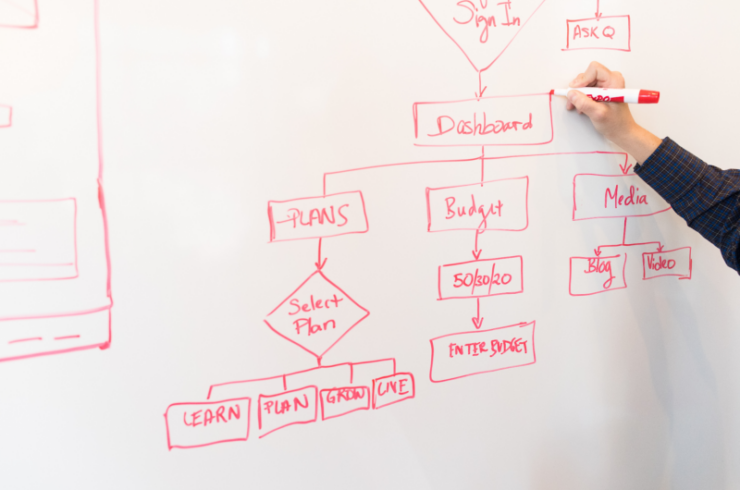
2. Flowcharts
Flowcharts are another popular device that can be used for visual project management. They are essentially diagrams that illustrate the flow of information or data.
They can be used to visualize just about anything, but are most commonly used to visualize processes.
Flowcharts can be extremely helpful when trying to understand a complex process. By breaking down the process into a series of steps, you can more easily see where things might go wrong.
They can also be an excellent tool when communicating processes to team members or stakeholders.
3. Mind Maps
Mind maps are a tool that can be used for brainstorming, problem-solving, and project planning.
They show the relationships between ideas or concepts, and are often used to visualize brainstorming sessions as they can help you see the connections between different ideas.
Additionally, mind maps can be used to plan projects by mapping out all of the tasks that need to be completed. This can be helpful in ensuring that no tasks are forgotten and that everyone on the team knows what needs to be done.

4. Kanban Boards
Kanban boards are a popular tool that is often used in agile project management. They visually represent the work that needs to be done on a project.
They typically consist of a series of columns, each of which represents a different stage in the work process. As work is completed, it is moved from one column to the next until it is finally marked as complete.
Kanban boards can be extremely helpful in keeping track of progress on a project, making sure it’s streamlined and ensuring that everyone on the team is aware of what needs to be done.
They are also useful in helping to identify bottlenecks in the work process so that you can address them appropriately before they have an impact on the project outcome.
5. Dashboards
Dashboards can be used to track just about anything. In the context of project management, they are typically used to track the progress of a project.
This can be done by tracking various metrics, such as the number of tasks completed, the amount of money spent, or the number of man-hours worked.
By tracking various metrics, dashboard allow you to quickly identify any problems or risks so that you can address them accordingly.
Additionally, dashboards can be used to communicate the progress of a project to team members or stakeholders.
Benefits of Visual Project Management
Visual project management has a number of benefits when it comes to project management on the whole. Let’s discuss a few of these in further detail.
1. Helps You See The Big Picture
One of the benefits of visual project management is that it helps you see the big picture. When you’re dealing with a lot of data, it can be easy to get lost in the details and lose sight of what’s important.
However, if you take the time to visualize your data, you’ll be able to see the forest for the trees, so to speak.
2. Helps You Communicate Your Ideas
Another great benefit of visual project management is that it helps you communicate your ideas more effectively to your team. If you’re trying to explain a complex concept to someone, it can be much easier to do so with the help of visuals.
3. Helps You Identify Potential Problems
Visual project management can further help you by identifying potential problems before they become actual problems. By visualizing your data, you’ll be able to see patterns and trends that you might not have noticed otherwise.
This can help you nip potential problems in the bud before they have a chance to cause any serious damage to your project’s outcome.
4. Helps You Make Better Decisions
Making decisions is an important part of project management. However, it’s not always easy to make the best possible decision.
With visual project management, you’ll be able to more easily weigh the pros and cons of different options and make a decision that’s in the best interest of your project.
5. Helps You Stay Organized
Last but not least, visual project management can help you stay organized. When you’re dealing with a lot of data, it can be easy to let things get out of control.
However, if you use visuals to keep track of your data, you’ll be able to stay on top of things and avoid getting bogged down in the details as you can look at your project from a holistic point of view.

Examples of Visual Project Management Software
A lot of people think that visual project management is all about using pretty charts and graphs. While it’s true that visuals can be helpful for communicating information, there’s a lot more to visual project management than just making things look nice.
Let’s write up our own example of using visual project management techniques as below:
Imagine that you’re working on a project to launch a new product. There are a lot of moving parts, and you need to coordinate with several different teams in order to get everything done on time.
In the past, you might have created a traditional Gantt chart to track the progress of your project. But these days, you can use software resembling a Gantt chart to get the job done.
With visual project management tools like Trello, you can create a board that shows every task that needs to be completed, who is responsible for each task, and what the current status of each task is.
You can also add due dates, comments, and attachments to each task.
This kind of system has several advantages over a traditional Gantt chart.
- First, it’s much easier to update and change as the project progresses.
- Second, it’s more visually appealing, which makes it easier for people to understand what’s going on.
- Lastly, it allows you to track progress at a glance, which is essential for keeping your project on track.
If you’re looking for a more visual way to manage your projects, visual project management tools like Trello are definitely worth checking out.
Other visual project management tools and how they can be used are summarised below:
- Wrike: A project management tool that allows you to create visual workflows and Gantt charts.
- Asana: An industry leading tool that lets you create Kanban boards, timelines, and calendars.
- Smartsheet: A spreadsheet application that offers Gantt chart, calendar, and card views.
- Basecamp: Software that offers a variety of features, including to-do lists, message boards, and file sharing.

Conclusion
We hope that this article has given you a better understanding of visual project management, its benefits and some useful software you can use to employ it in your next project.
There are a number of different tools and techniques that can be used for visual project management. Some of the most popular tools include Gantt charts, flowcharts, mind maps, Kanban boards, and dashboards.
If you’re looking to get started with visual project management, we recommend trying out one or more of the tools and techniques that we’ve listed above.
The wide range of benefits tell us there’s no time to waste — get started with visual project management now!